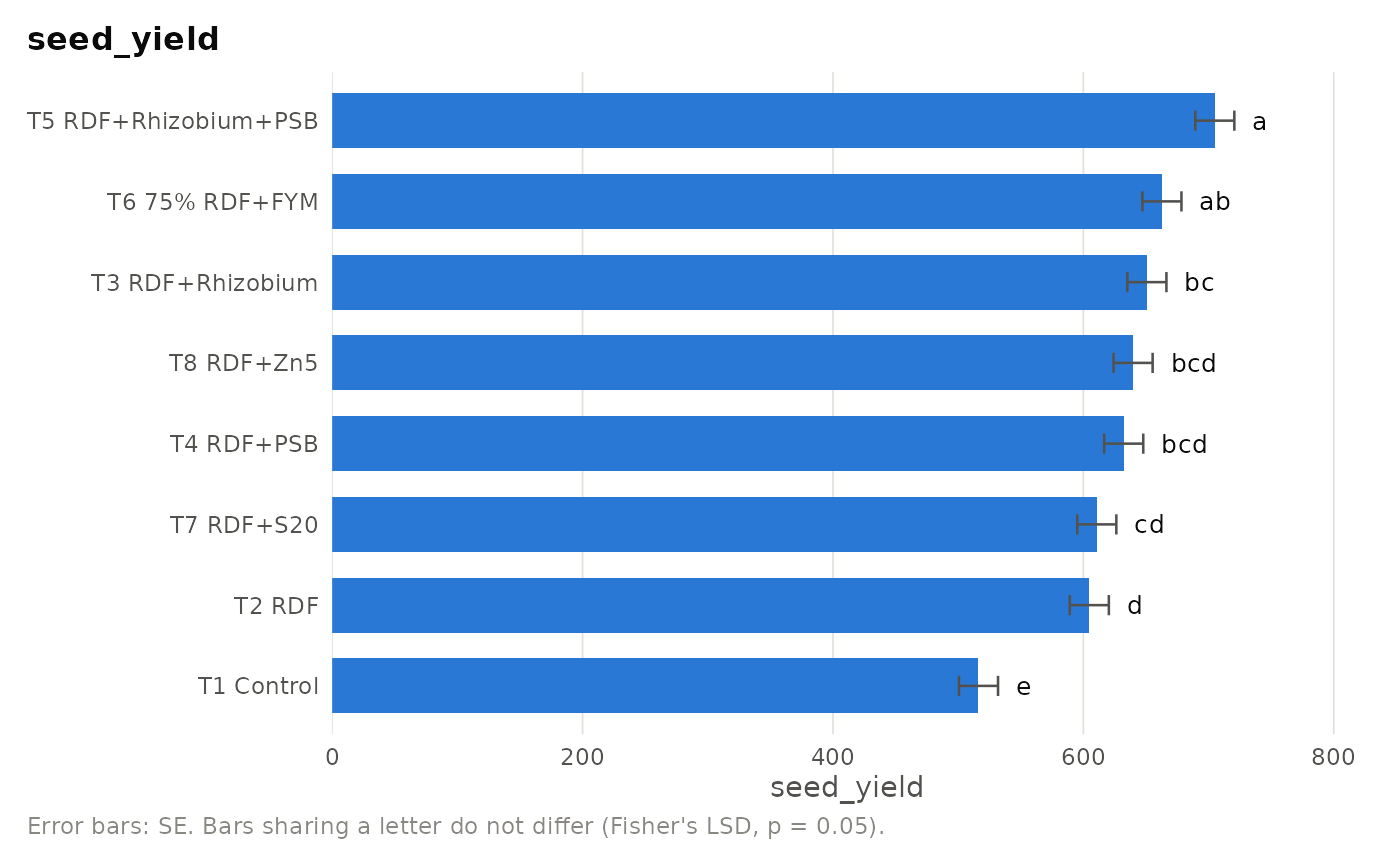
plot() methods that draw the standard publication figure for each
kind of result with ggplot2: a bar chart of means with letters
(CRD, RCBD, Latin square, pooled RCBD, alpha lattice, augmented), an
interaction plot or bar chart (factorial and split-plot designs), a
time course (repeated measures) or a stability plot. For base graphics
without ggplot2, use arid_plot.
Usage
# S3 method for class 'aridagri_anova'
plot(x, ...)

# S3 method for class 'aridagri_pooled'
plot(x, ...)

# S3 method for class 'aridagri_alpha'
plot(x, ...)

# S3 method for class 'aridagri_augmented'
plot(x, ...)

# S3 method for class 'aridagri_factorial'
plot(x, type = c("interaction", "means"), ...)

# S3 method for class 'aridagri_split'
plot(x, type = c("interaction", "means"), ...)

# S3 method for class 'aridagri_strip'
plot(x, ...)

# S3 method for class 'aridagri_repeated'
plot(x, ...)

# S3 method for class 'aridagri_stability'
plot(x, type = c("eberhart", "ammi1", "ammi2"), ...)
Arguments
- x
A result object.
- ...
Passed to
plot_means,plot_interactionorplot_stability.- type
For factorial and split-plot results:
"interaction"(default) or"means". For stability results:"eberhart"(default),"ammi1"or"ammi2".
Examples
if (requireNamespace("ggplot2", quietly = TRUE)) {
  data(mothbean_rbd)
  res <- anova_rbd(mothbean_rbd, "seed_yield", "treatment", "block",
                   verbose = FALSE)
  plot(res)
}