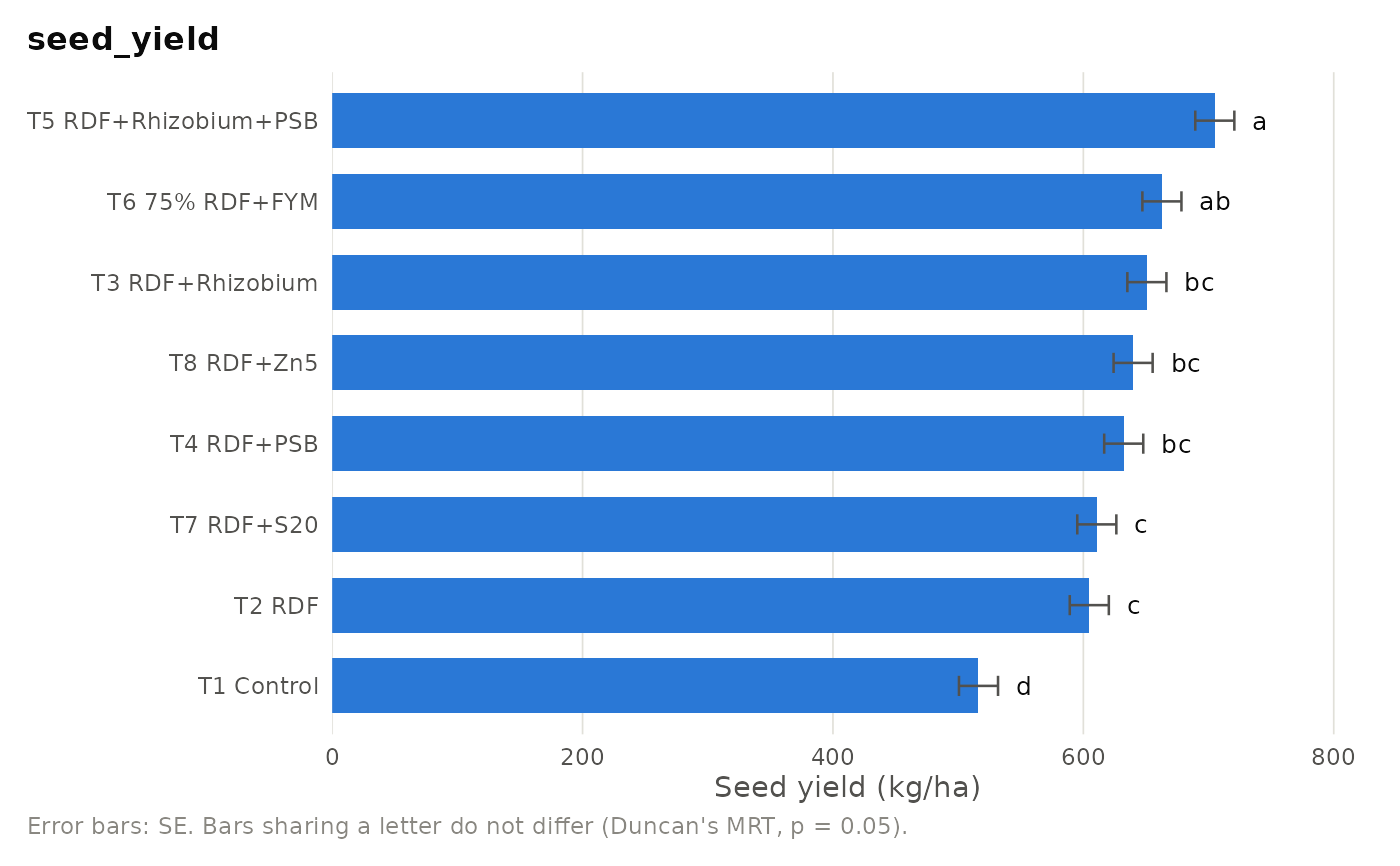
Publication-ready bar chart of treatment means with standard-error bars
and the letter groupings from an aridagri analysis. Works with the
results of anova_crd, anova_rbd,
anova_latin, anova_rbd_pooled,
anova_factorial (one factor or the combinations),
anova_spd and the other split-plot functions (one factor),
anova_alpha_lattice and anova_augmented
(adjusted means).
Usage
plot_means(
  x,
  which = NULL,
  sort = TRUE,
  top = 20,
  title = NULL,
  ylab = NULL,
  horizontal = NULL
)
Arguments
- x
A result object from one of the functions above.
- which
For factorial and split-plot results, the factor to plot (name), or
"interaction"for the treatment combinations of a two-factor factorial. Default: the first factor.- sort
Logical. Order bars from highest to lowest mean. Default TRUE.
- top
For alpha lattice and augmented results, the number of entries to show. Default 20.
- title
Plot title. Default: the response name.
- ylab
Y-axis label. Default: the response name.
- horizontal
Logical. Draw horizontal bars. Default
NULLchooses horizontal bars when labels are long or there are more than 12 bars.
Examples
if (requireNamespace("ggplot2", quietly = TRUE)) {
  data(mothbean_rbd)
  res <- anova_rbd(mothbean_rbd, "seed_yield", "treatment", "block",
                   posthoc = "duncan", verbose = FALSE)
  plot_means(res, ylab = "Seed yield (kg/ha)")
}