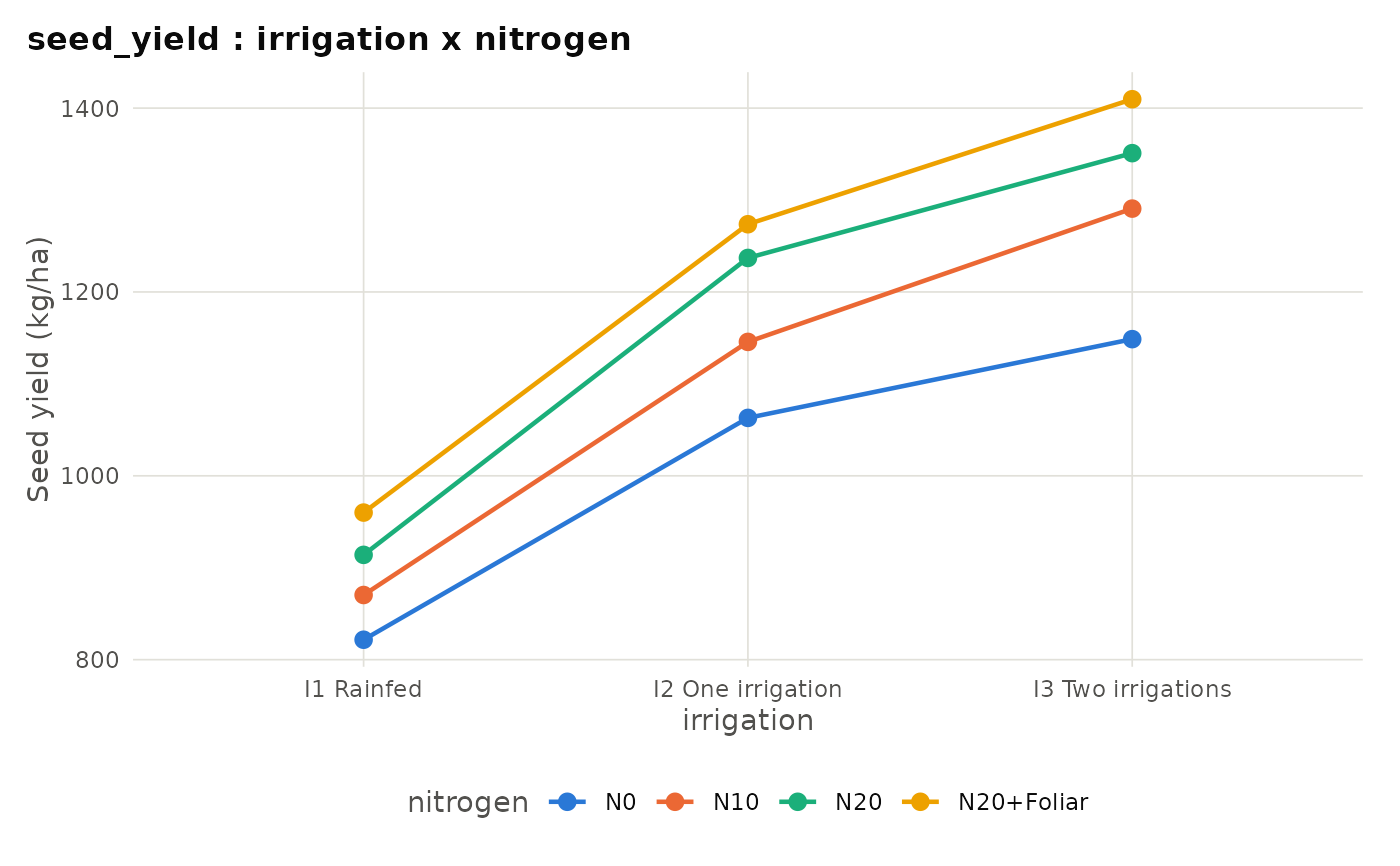
Line chart of the means of every combination of two factors, with the
first factor on the x-axis and one line per level of the second factor.
Works with anova_factorial, anova_spd and
the other split-plot functions (first two factors, or the two named in
factors), anova_strip and
anova_repeated (time course).
Examples
if (requireNamespace("ggplot2", quietly = TRUE)) {
  data(clusterbean_spd)
  res <- anova_spd(clusterbean_spd, "seed_yield", "irrigation",
                   "nitrogen", "rep", verbose = FALSE)
  plot_interaction(res, ylab = "Seed yield (kg/ha)")
}