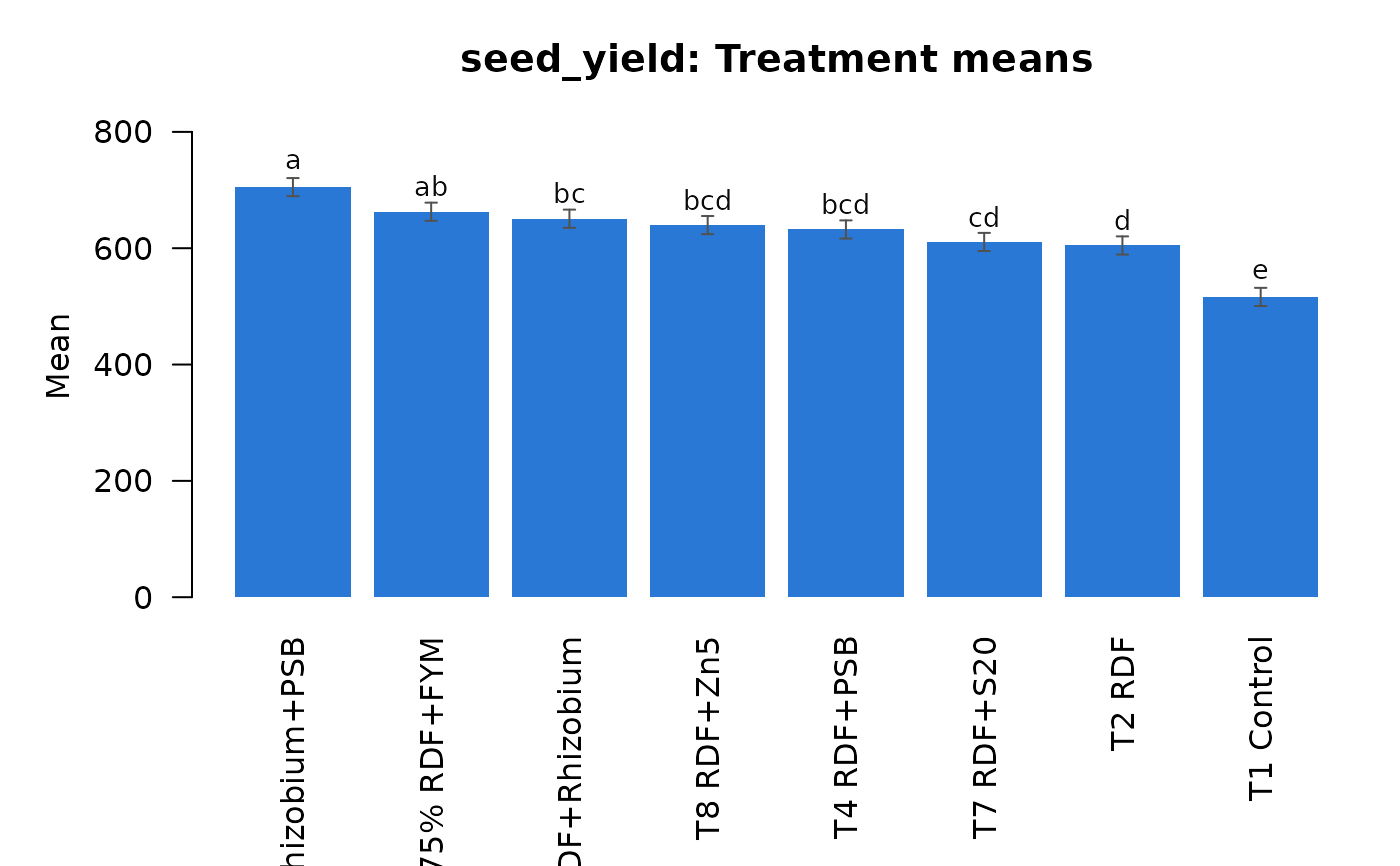
Quick plots with base graphics (no extra packages): bar charts of
treatment or factor means with their letters for ANOVA results, a
heatmap for correlation results and the integrated ranking for stability
results. For publication figures with ggplot2 see
plot_means and the plot() methods.
Usage
arid_plot(x, type = "bar", ...)
Arguments
- x
An object from an aridagri analysis function.
- type
Kept for compatibility; bar charts are drawn.
- ...
Unused.
Value
No return value; called for its side effect of drawing a plot.
Author
Lalit Kumar Rolaniya, Ram Lal Jat, Monika Punia, Raja Ram
Choudhary, Hemant Poonia
Examples
data(mothbean_rbd)
res <- anova_rbd(mothbean_rbd, "seed_yield", "treatment", "block",
                 verbose = FALSE)
arid_plot(res)