Figures for stability_analysis results:
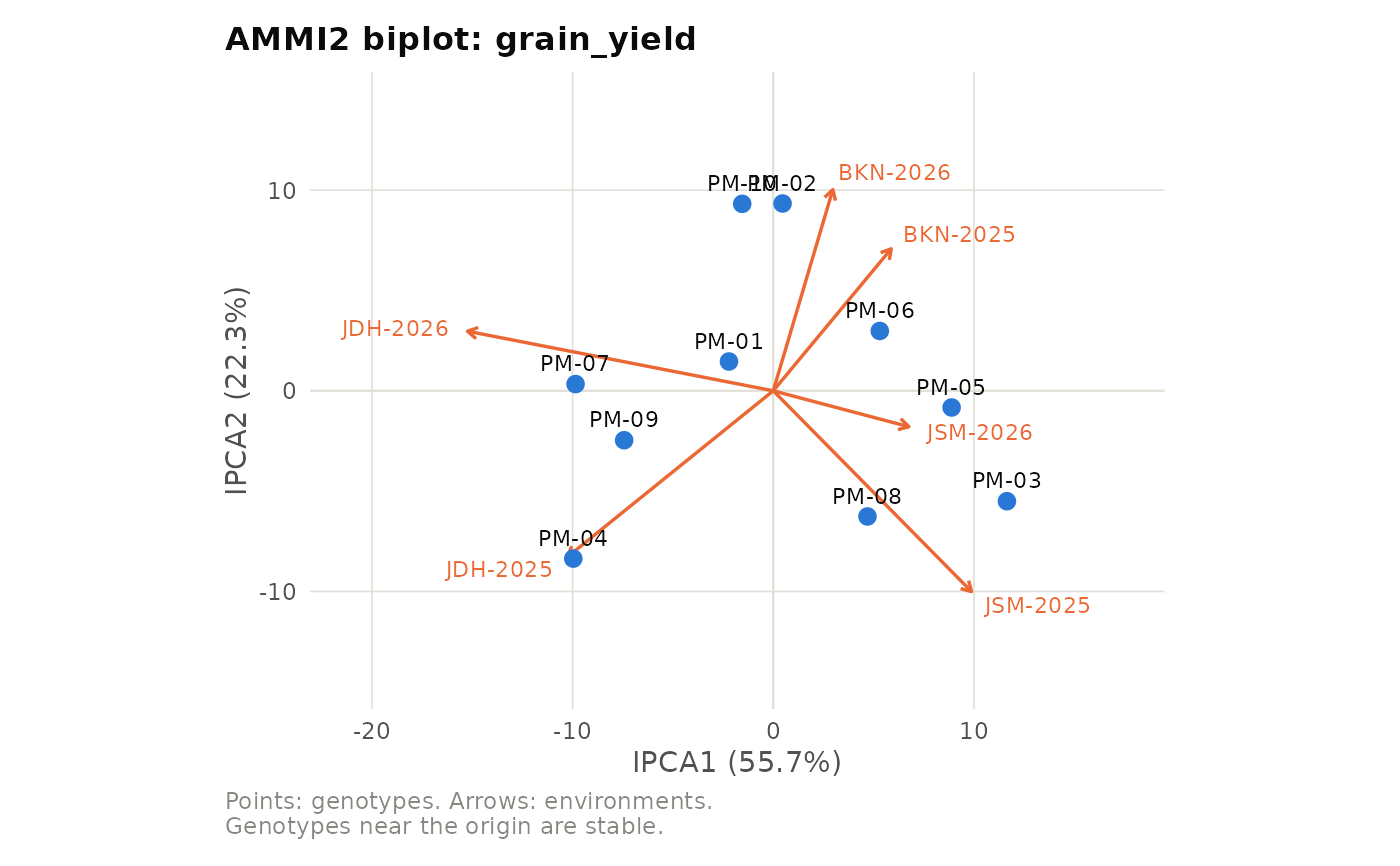
"eberhart": genotype mean against the regression coefficient \(b_i\), with reference lines at the grand mean and \(b_i = 1\)."ammi1": AMMI1 biplot of mean against IPCA1 scores for genotypes and environments."ammi2": AMMI2 biplot of IPCA1 against IPCA2, with environments as vectors.
Usage
plot_stability(x, type = c("eberhart", "ammi1", "ammi2"), title = NULL)Examples
if (requireNamespace("ggplot2", quietly = TRUE)) {
  data(pearlmillet_met)
  st <- stability_analysis(pearlmillet_met, "genotype", "environment",
                           "rep", "grain_yield", verbose = FALSE)
  plot_stability(st, "eberhart")
  plot_stability(st, "ammi2")
}