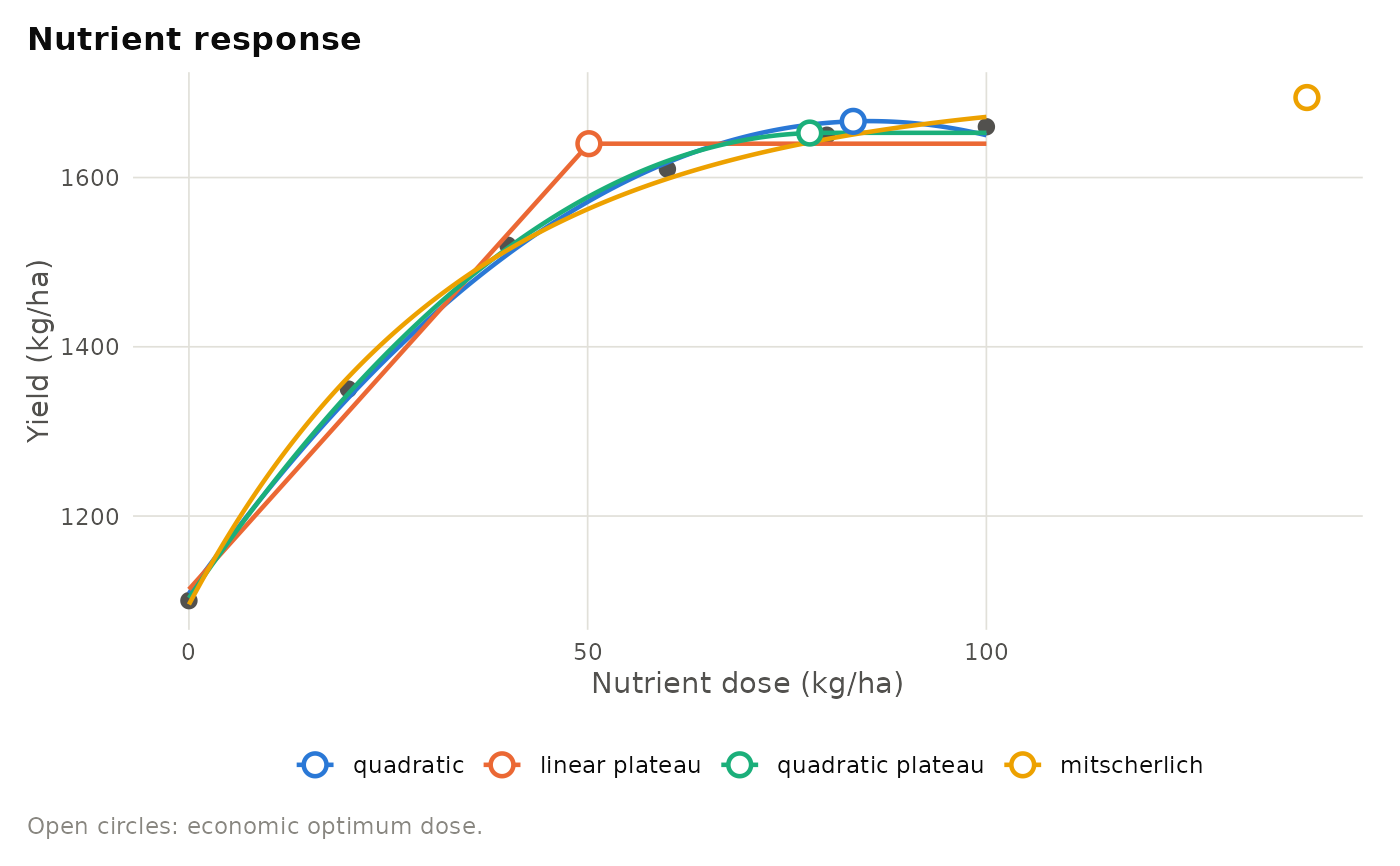
Observed yields and the fitted response curve(s) from
nutrient_response, with the economic optimum dose marked.
Examples
if (requireNamespace("ggplot2", quietly = TRUE)) {
  dose <- c(0, 20, 40, 60, 80, 100)
  yield <- c(1100, 1350, 1520, 1610, 1650, 1660)
  nr <- nutrient_response(dose, yield, model = "all", verbose = FALSE)
  plot_response(nr, dose, yield)
}