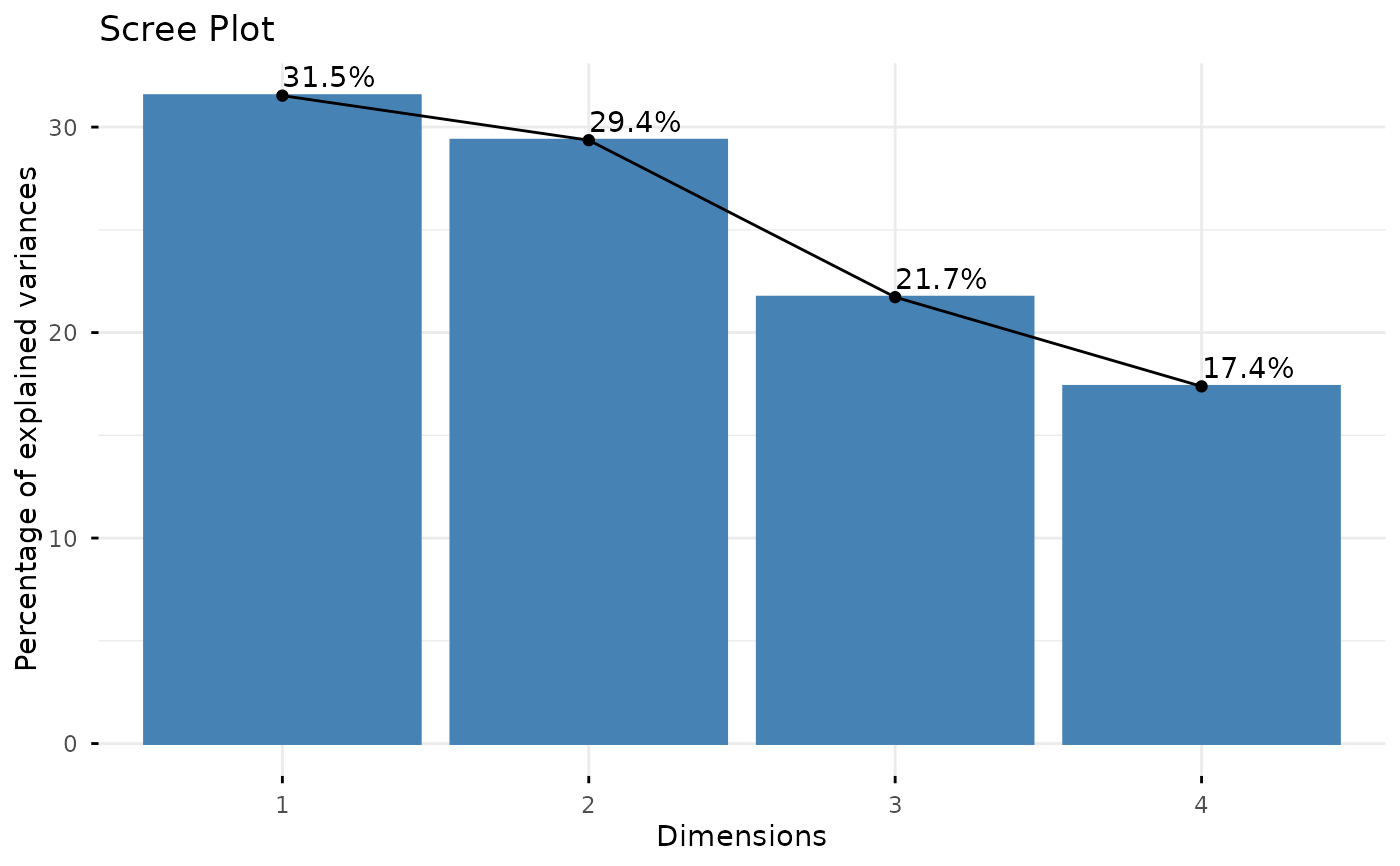
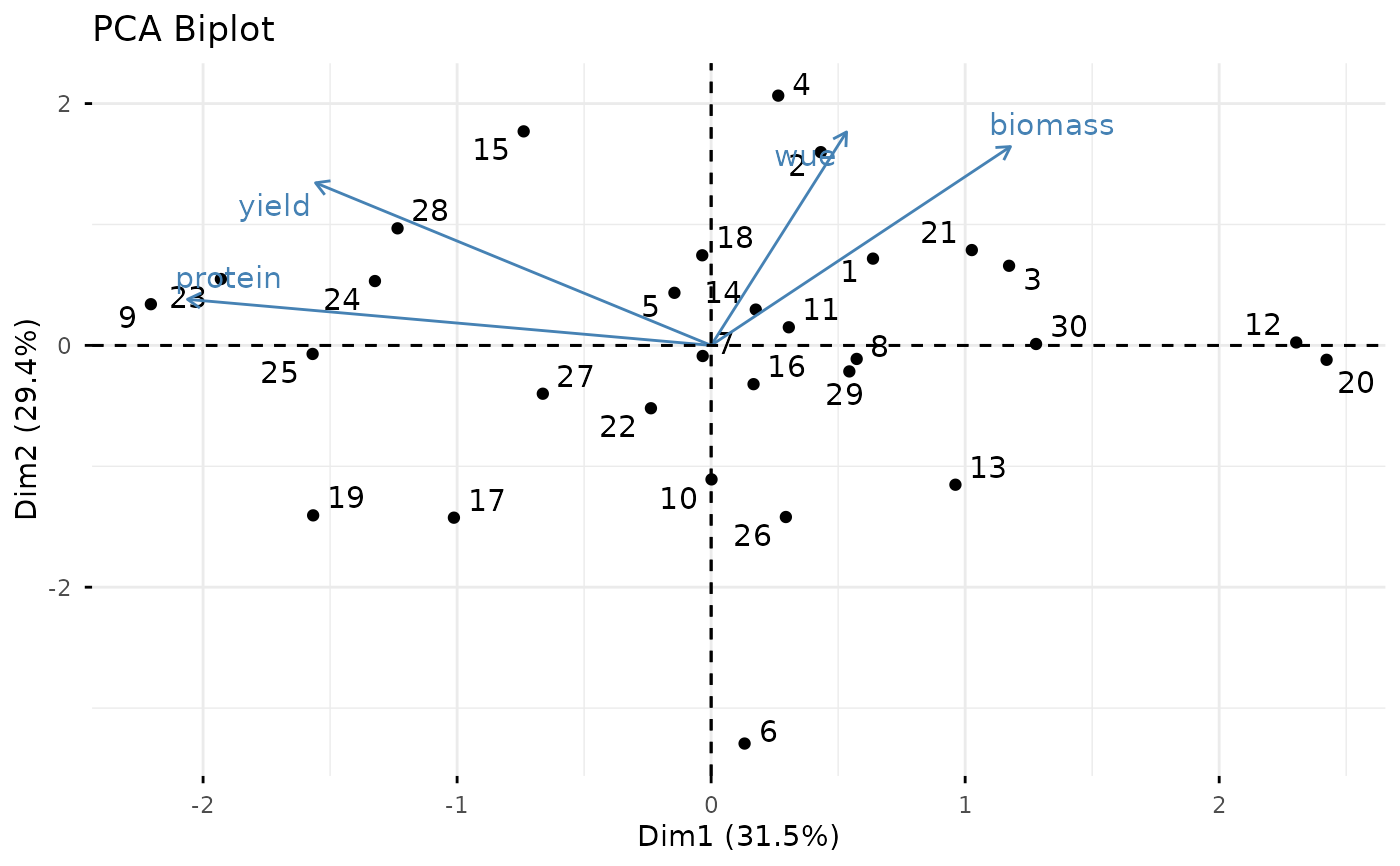
Performs PCA with visualization suitable for agricultural research data. Includes scree plot, biplot, and variable contributions.
Examples
data <- data.frame(
  yield = rnorm(30, 1200, 200),
  wue = rnorm(30, 4.5, 0.5),
  protein = rnorm(30, 22, 2),
  biomass = rnorm(30, 3500, 500)
)
pca_analysis(data)
#>
#> ==========================================================
#>           PRINCIPAL COMPONENT ANALYSIS
#> ==========================================================
#> Variables: 4
#> Observations: 30
#> Scaling: Yes
#>
#> --- Eigenvalues and Variance Explained ---
#>
#>    PC Eigenvalue Variance_Percent Cumulative_Percent
#> 1 PC1      1.261            31.53              31.53
#> 2 PC2      1.175            29.36              60.89
#> 3 PC3      0.869            21.72              82.62
#> 4 PC4      0.695            17.38             100.00
#>
#> --- Variable Loadings (First 3 PCs) ---
#>
#>            PC1   PC2    PC3    PC4
#> yield   -0.539 0.482  0.408 -0.558
#> wue      0.184 0.633 -0.733 -0.166
#> protein -0.713 0.137 -0.210  0.654
#> biomass  0.408 0.590  0.502  0.483
#>
#> --- Recommendation ---
#> Components retained by the Kaiser criterion: 2
#> Variance explained by 2 components: 60.9 %