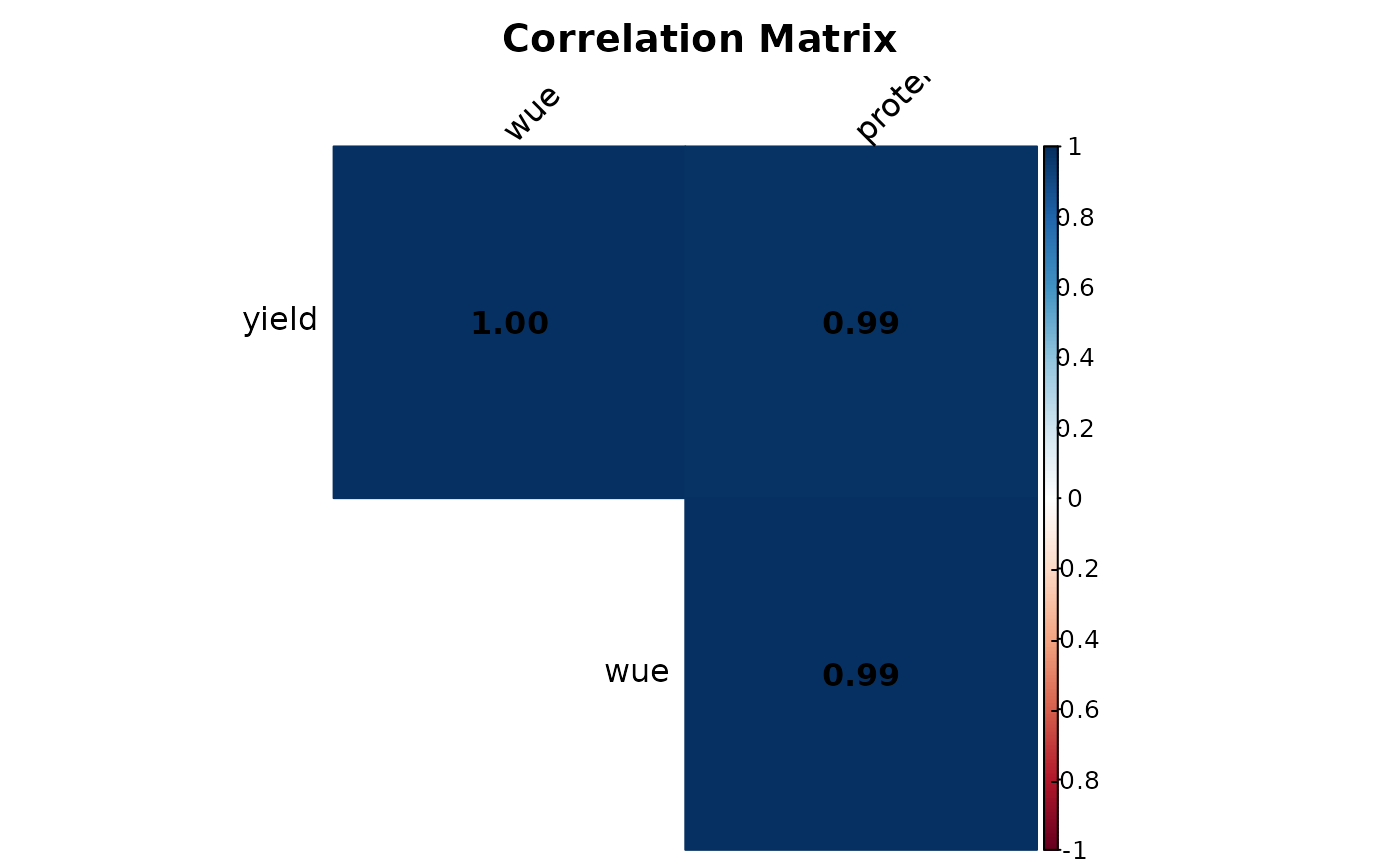
Computes correlation matrix with significance levels and generates publication-ready correlation table and plot.
Examples
data <- data.frame(
  yield = c(1200, 1350, 1100, 1450, 1280),
  wue = c(4.2, 4.8, 3.9, 5.1, 4.5),
  protein = c(22.1, 23.5, 21.8, 24.2, 22.9)
)
correlation_analysis(data)
#>
#> ==========================================================
#>           CORRELATION ANALYSIS
#> ==========================================================
#> Method: pearson
#> Number of observations: 5
#> Number of variables: 3
#>
#> --- Correlation Matrix ---
#>
#>         yield   wue protein
#> yield   1.000 0.998   0.987
#> wue     0.998 1.000   0.993
#> protein 0.987 0.993   1.000
#>
#> --- Significance Levels ---
#> *** p < 0.001, ** p < 0.01, * p < 0.05, . p < 0.1