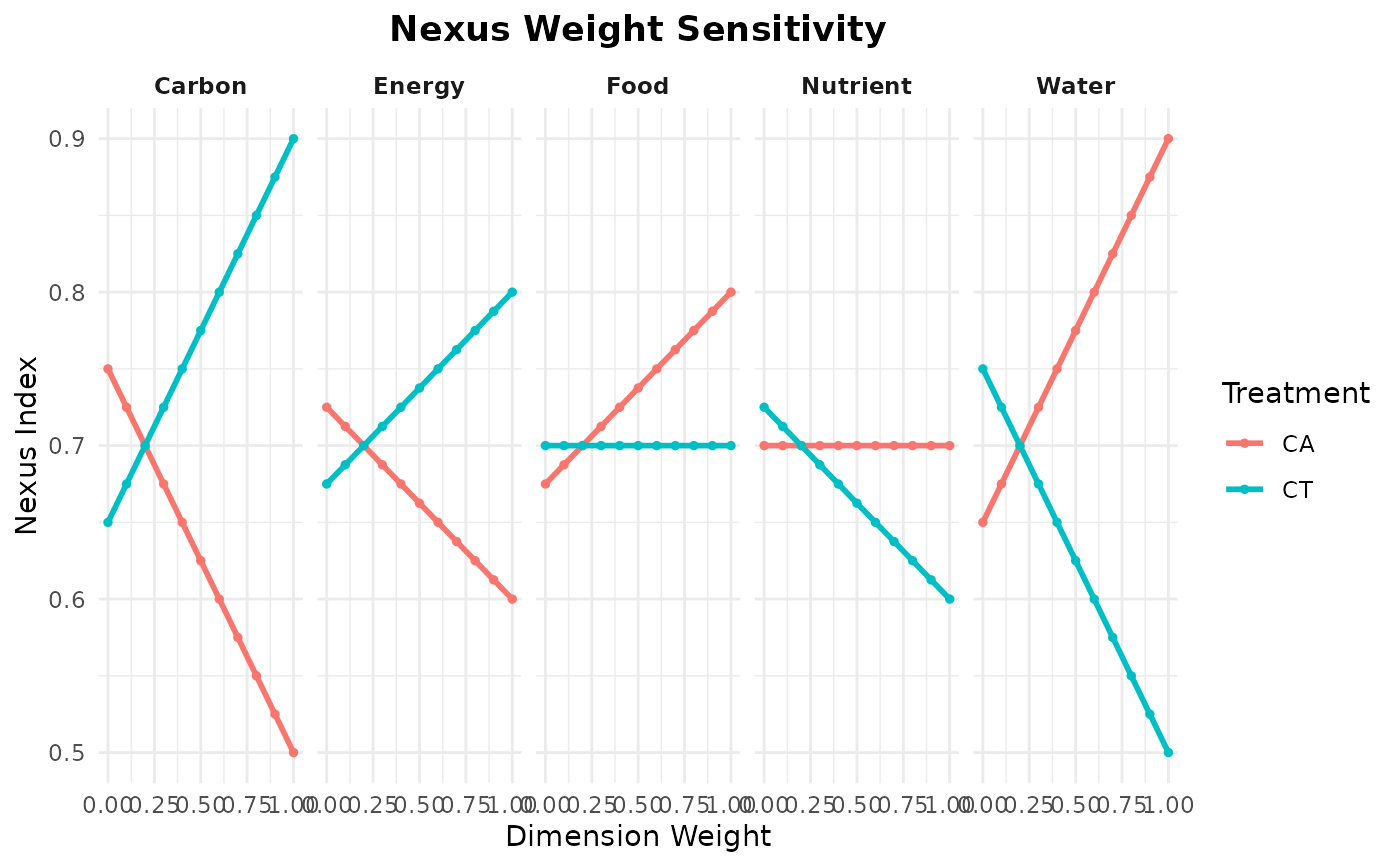
Visualises the output of nexus_sensitivity as faceted
line plots showing how the nexus index changes with dimension weights.
plot_sensitivity(sa, title = "Nexus Weight Sensitivity")Arguments
- sa
Data frame returned by
nexus_sensitivity.- title
Character. Plot title.
Value
A ggplot2 object.
Examples
# \donttest{
if (requireNamespace("ggplot2", quietly = TRUE)) {
  sa <- nexus_sensitivity(
    water_score = c(0.9, 0.5), energy_score = c(0.6, 0.8),
    food_score = c(0.8, 0.7), nutrient_score = c(0.7, 0.6),
    carbon_score = c(0.5, 0.9),
    treatment_names = c("CA", "CT"), steps = 10
  )
  plot_sensitivity(sa)
}
#> Sensitivity analysis: 11 weight steps x 5 dimensions x 2 treatments.

# }
# }