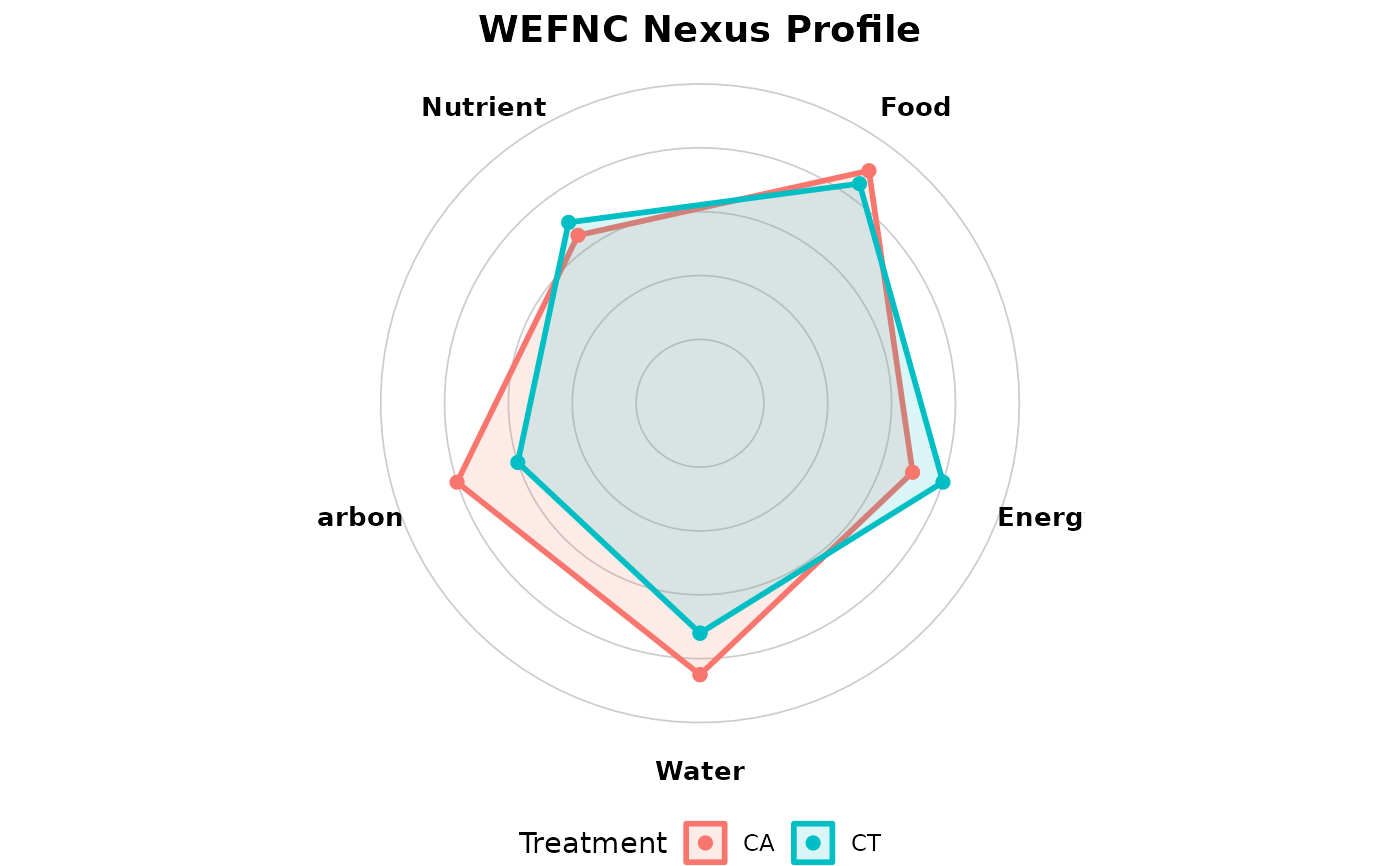
Publication-quality radar chart using ggplot2 for WEFNC nexus profiles.
nexus_radar_gg(
  scores,
  treatment_names = NULL,
  dim_labels = c("Water", "Energy", "Food", "Nutrient", "Carbon"),
  title = "WEFNC Nexus Profile"
)
Arguments
- scores
A matrix or data frame (treatments as rows, dimensions as columns). Values should be on a 0 to 1 scale.
- treatment_names
Character vector. Labels for treatments.
- dim_labels
Character vector. Labels for nexus dimensions. Default: Water, Energy, Food, Nutrient, Carbon.
- title
Character. Plot title.
Value
A ggplot2 object.
Examples
# \donttest{
if (requireNamespace("ggplot2", quietly = TRUE)) {
  scores <- matrix(c(0.85, 0.70, 0.90, 0.65, 0.80,
                      0.72, 0.80, 0.85, 0.70, 0.60),
                   nrow = 2, byrow = TRUE)
  nexus_radar_gg(scores, treatment_names = c("CA", "CT"))
}

# }
# }