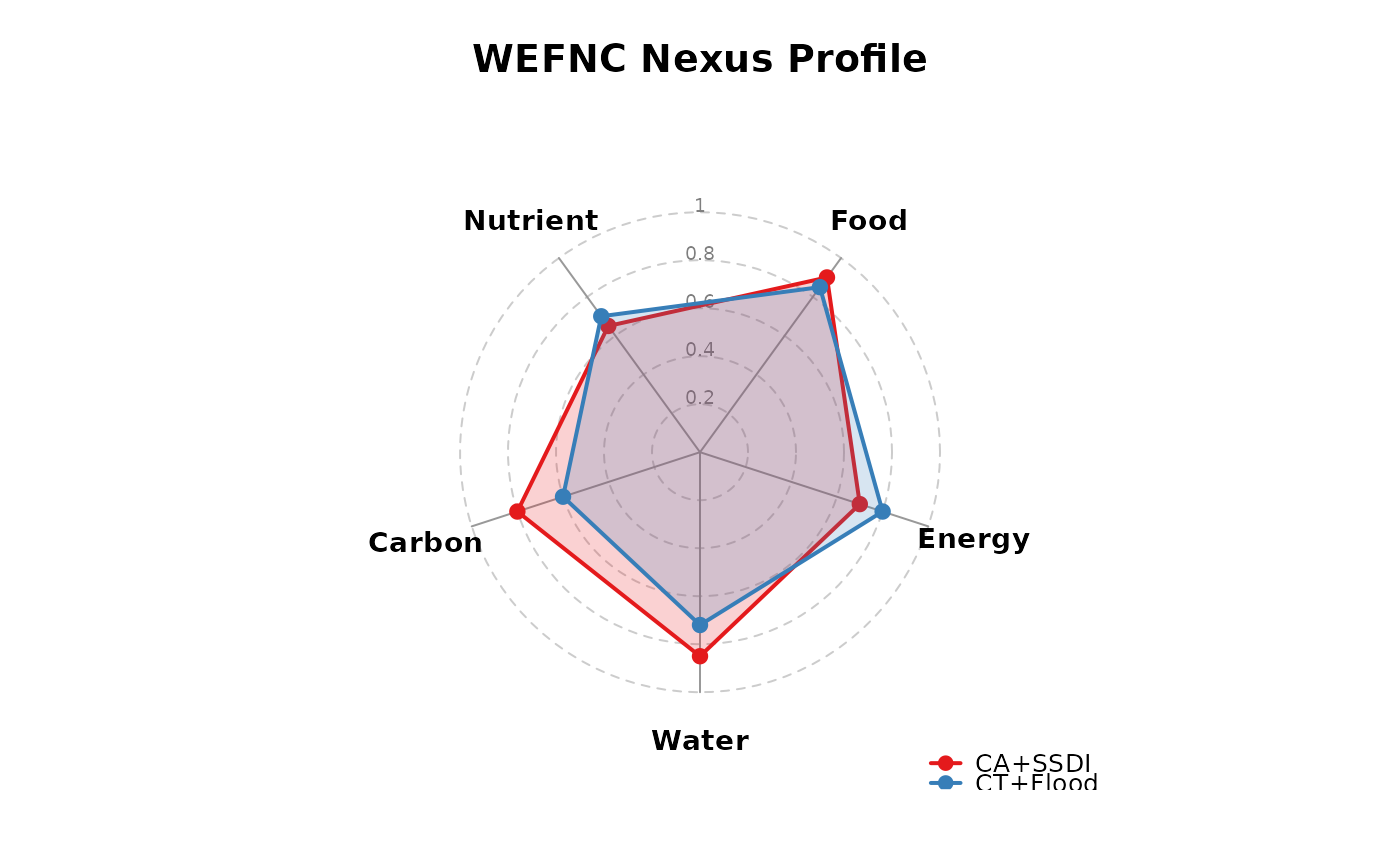
Creates a radar (spider/web) chart showing the WEFNC nexus profile of one or more treatments.
nexus_radar(
  scores,
  labels = c("Water", "Energy", "Food", "Nutrient", "Carbon"),
  treatment_names = NULL,
  colors = NULL,
  title = "WEFNC Nexus Profile",
  fill = TRUE,
  alpha = 0.2
)
Arguments
- scores
A matrix or data frame where rows represent treatments and columns represent nexus dimensions. Values should be on a 0 to 1 scale.
- labels
Character vector. Names for nexus dimensions. Default: Water, Energy, Food, Nutrient, Carbon.
- treatment_names
Character vector. Labels for each treatment.
- colors
Character vector. Colors for each treatment.
- title
Character. Plot title. Default "WEFNC Nexus Profile".
- fill
Logical. If
TRUE, fills the radar polygon area. DefaultTRUE.- alpha
Numeric. Fill transparency (0 to 1). Default 0.2.
Value
Invisibly returns the input scores matrix. Called
primarily for the side effect of generating a radar plot.