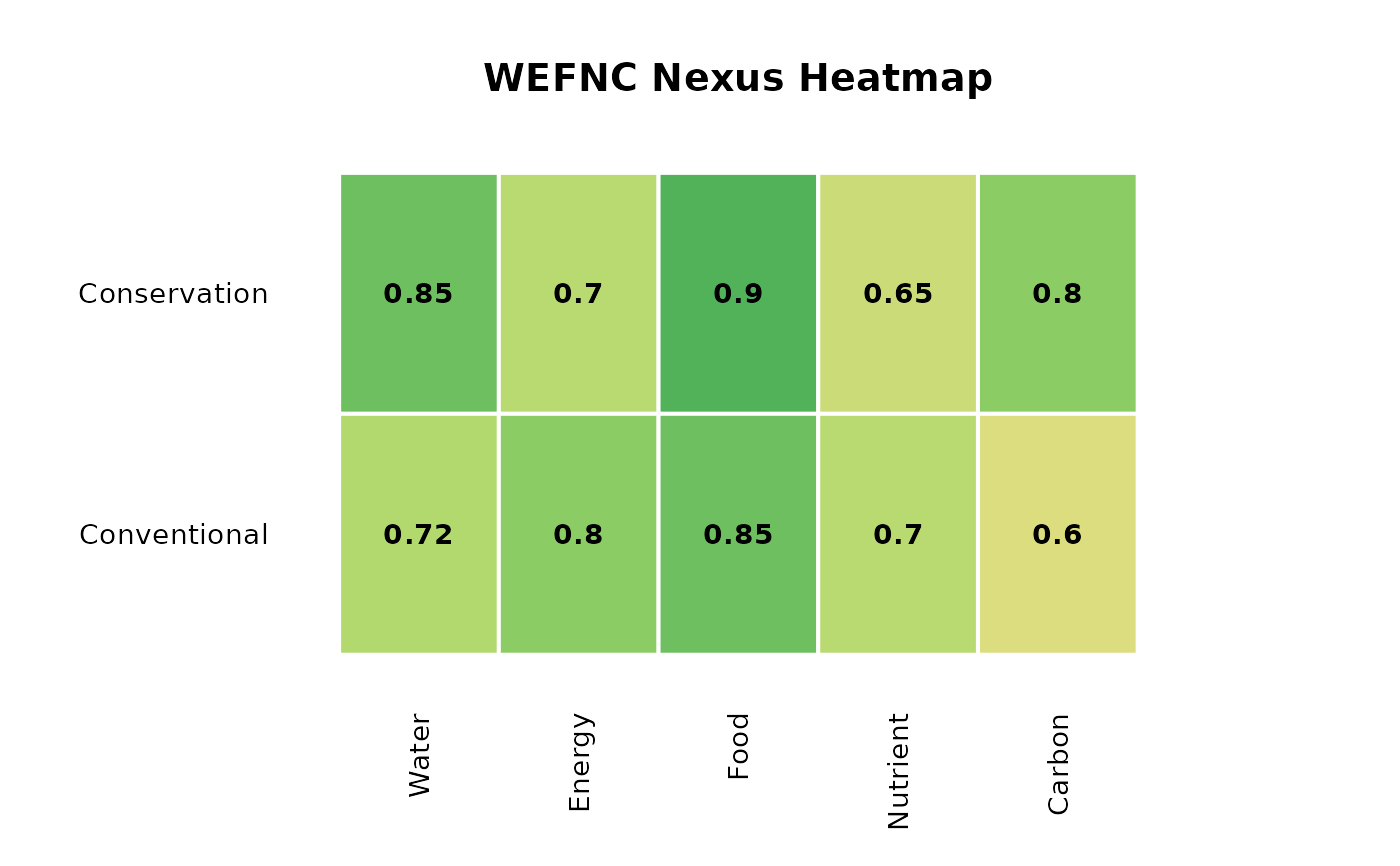
Creates a heatmap showing nexus dimension scores across treatments.
nexus_heatmap(
  scores,
  row_labels = NULL,
  col_labels = NULL,
  title = "WEFNC Nexus Heatmap",
  color_palette = NULL
)
Arguments
- scores
A matrix or data frame where rows represent treatments and columns represent nexus dimensions.
- row_labels
Character vector. Treatment names.
- col_labels
Character vector. Dimension names.
- title
Character. Plot title. Default "WEFNC Nexus Heatmap".
- color_palette
Character vector of colors for gradient. Default is a red-yellow-green palette.
Value
Invisibly returns the input scores matrix. Called
primarily for the side effect of generating a heatmap plot.